A practical guide to understanding a pump curve
Introduction
Did you know that 90% of pump-related problems stem from the system in which they are integrated, not from the pump itself? Selecting the right pump is not enough: a complete system analysis is crucial.Pumps play an essential role in many industrial processes - water supply, heating systems, chemical processes and so on. However, their optimal operation inevitably depends on mastering performance curves, which are often neglected or misinterpreted. Misreading these curves can lead to inappropriate selections, energy inefficiencies and even premature failures.
The aim of this practical guide is to provide a clear, step-by-step explanation of the different types of pump curves - whether centrifugal or positive displacement - and to show how to interpret them to ensure reliable, economical operation.
1.Pump curve?
A pump curve is a graphical representation of a pump's performance under various operating conditions. It mainly illustrates the relationship between flow rate (Q), generally expressed in US gallons per minute (US gpm) or m³/h, and total head (TH), expressed in feet (ft) or meters of water column (mWC).
It allows you to :
- Understand how the pump reacts to different flow demands;
- Evaluate its ability to maintain adequate pressure in a system;
- Ensure proper selection according to actual process requirements.
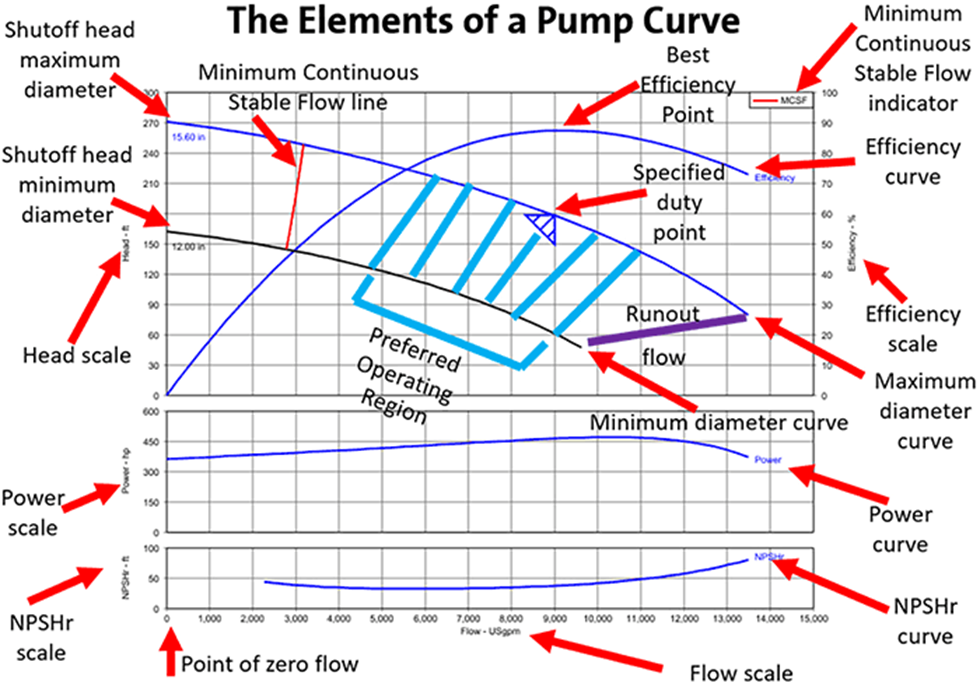
2. Elements of a pump performance curve
A pump curve is a group of superimposed or juxtaposed curves. Here are the main ones to analyze:
- H-Q curve (Head vs. Flow)
This curve shows the relationship between head (H) and flow (Q).It enables you to:
- Check whether the pump can generate sufficient pressure for a given flow rate;
- Determine the actual operating point (intersection with the system curve);
- Avoid oversizing or undersizing.
- Efficiency curve (η)
This curve helps to identifies the best efficiency point (BEP) for selecting an efficient pump.
It helps to:
- Reduce energy consumption;
- Limit premature wear and vibration;
- Select the right model or impeller.
- NPSHr curve (Net Positive Suction Head required)
This curve indicates the minimum suction pressure required to avoid cavitation.
It helps to:
- Check that the suction system is well designed (height, pressure, temperature);
- Avoid irreversible damage to impellers;
- Ensure long pump life.
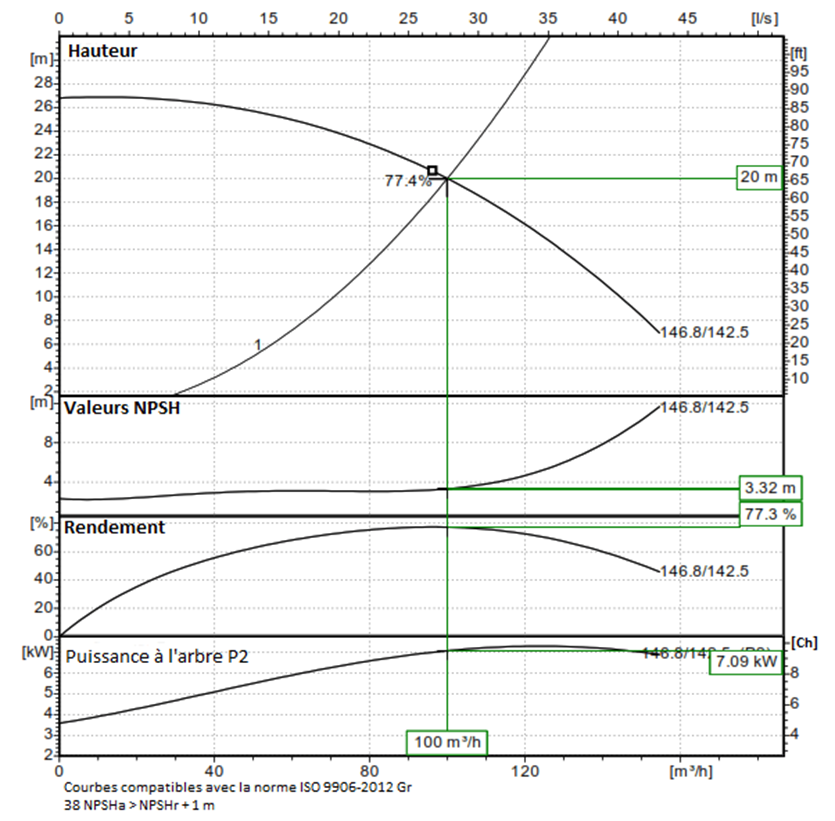
3. Performance curves for centrifugal pumps
Centrifugal pumps account for around 70% of industrial and commercial pumping applications: water, process fluids, heating, cooling, etc.
Their typical H-Q curve has a descending parabolic (or inverted half-moon) shape:
- Vertical axis (ordinate): manometric head (HMT), in m or ft ;
- Horizontal axis (abscissa): flow rate (Q), in m³/h, l/min or gpm.
Interpretation: - Left: high pressure, low flow (valve closed) → risk of overheating, blade wear, excessive axial thrust ;
- Right: high flow, low pressure (valve open) → risk of cavitation, low efficiency, motor overload ;
- Center: BEP, optimum operating zone → maximum efficiency, low wear.
Operation outside the BEP generates vibrations, noise, excessive energy consumption and accelerated component wear.
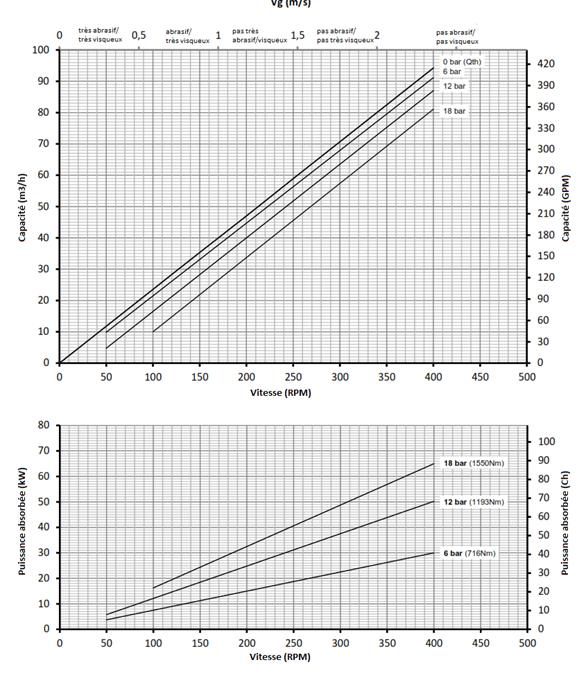
4.Volumetric pump curves
The curves of positive-displacement pumps (piston, gear, diaphragm…) are different: they often appear as a straight or slightly inclined line, illustrating a virtually constant flow rate regardless of downstream pressure.
This is explained by their mechanical operation: each cycle moves a fixed volume of fluid. Flow is therefore proportional to rotational speed (rpm), with little influence from back pressure.
Influence of viscosity :
Curves can incorporate secondary lines for different viscosity levels (water, oil, polymers…). This makes it possible to :
- Select the right model for the fluid being pumped ;
- Ensure consistent flow rates, essential in many industrial applications.
5. NPSH and cavitation risk
The NPSH (Net Positive Suction Head) is crucial to avoid cavitation.
- NPSHa (available): energy available at pump inlet (calculated according to system).
- NPSHr (required): minimum required by the pump to avoid cavitation (indicated by the manufacturer).
Rule of thumb :
NPSHa > NPSHr + safety margin (usually 0.5 to 1 m)
Consequences of cavitation :
- Formation of vapour bubbles which implode violently;
- Characteristic noises (clattering, crackling);
- Erosion of blades, vibrations, loss of performance ;
- Premature wear of internal components.
Conclusion
Reading a pump curve is more than just a technical formality: it's a strategic tool for ensuring the reliability, energy efficiency and longevity of your systems.
Each parameter - flow, pressure, efficiency, NPSH - helps to :
- Understand the pump's operating limits;
- Anticipate problems (cavitation, overheating, vibration);
- Select the right model for your needs.
Whether you choose a centrifugal or positive-displacement pump, remember that proper operation depends as much on the system as on the pump.